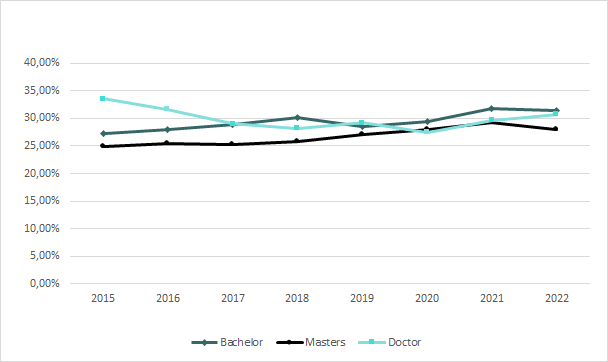
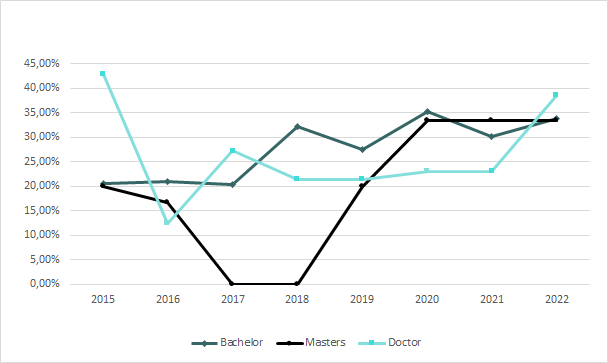
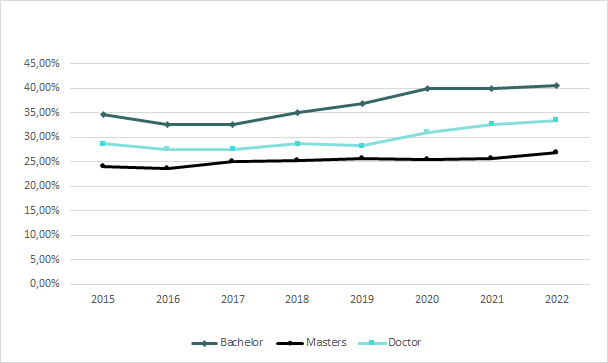
How has the share of women in physics evolved across Europe — and where do we see progress, stagnation, or setbacks?
The following interactive visualizations track the percentage of women enrolled in Physics bachelor’s,
master’s, and PhD programmes across different European regions from 2015 to 2023, based on
Eurostat
data (last update: December 2025).
Explore how participation changes over time, compare regions, and follow the academic pipeline from
undergraduate studies to doctoral level.
How are women represented in physics across Europe? Explore interactive maps showing the average share of women in physics at different academic levels.
Did you know that, of the 229 people to be awarded the Nobel Prize in Physics, only five have been women? This section addresses imbalances of recognition